
The S&P 500 opened Q2 with one of its steepest intra-quarter drawdowns in recent memory.
On April 2nd, dubbed “Liberation Day,” the U.S. moved forward with the implementation of a tariff package on strategic imports from Asia and Europe, and the Americas. While long signaled by hawkish elements within the administration, we had remained hopeful that diplomacy and deal-making would prevail. When the tariffs officially landed, the reaction was swift and severe. Over the course of just six trading days, the S&P 500 fell nearly 11% (and was down 20% from the February market peak). Technology and consumer discretionary led the decline, with particular pain seen in semiconductors and industrial machinery, key beneficiaries of a globally integrated supply chain.
Talk of the dreaded stagflation – inflation from rising prices combined with global economic slowdown from reduced trade and potential trade wars – increased, and both stock and bond markets voted “no confidence.” It was not simply the potential economic effects that created havoc, it was the erratic manner in which the tariffs were rolled out, creating massive uncertainty. And if the markets hate anything more than stagflation, it is uncertainty. The Trade Policy Uncertainty Index spiked to unprecedented levels during the quarter.
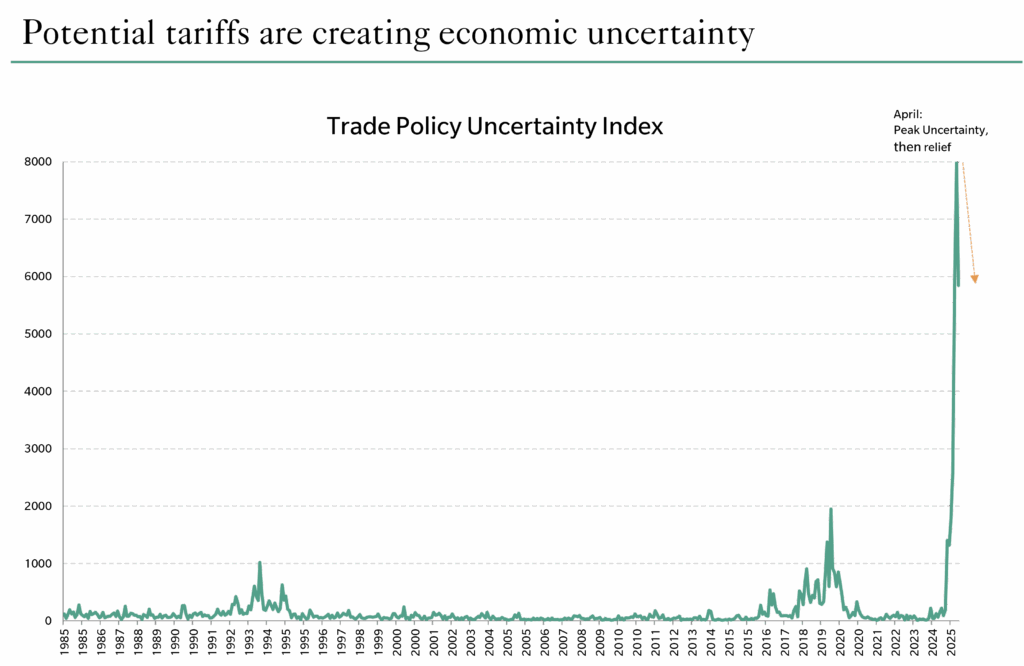
Source: Economic Policy Uncertainty (EPU) US monthly trade policy uncertainty index, Ballentine Partners. The index reflects the frequency of articles in 10 major American newspapers that discuss policy-related economic uncertainty and also contain one or more references to trade policy. Data: https://policyuncertainty.com/media/Categorical_EPU_Data.xlsx
Pressures mounted. Trump softened his stance within days. On April 9th, President Trump reversed course, observing that the markets had gotten, in his words, “a bit yippy.” He announced that the next phase of tariffs would be delayed by ninety days to allow for “constructive dialogue with our trading partners.” Equity markets breathed a sigh of relief. From that moment on, the risk-off posture that had dominated April’s first week and most of February and March, changed direction. Equity markets, particularly in the U.S., began a steady march upward, clawing back losses and then some. Market moods shifted from Yippy to Yahoo. By the end of June, the S&P 500 had fully recovered its April decline and posted a positive double-digit return for the quarter, up 10.9%. On a year-to-date basis, the S&P 500 is up 6.2%. The tech-heavy NASDAQ, meanwhile, surged even more, reflecting the new narrative: reduced trade tensions, resilient earnings, potential for AI, a belief that the market could focus on tax cuts and deregulation, and the potential for monetary easing if needed.
Under the Hood: Sector Dynamics and Style Rotation
Sector performance in Q2 followed the path of sentiment. In early April, traditional defensives like utilities and consumer staples briefly outperformed, consistent with a risk-averse environment. But by mid-quarter, leadership shifted decisively.
Technology, particularly AI-adjacent stocks, regained their footing quickly as trade tensions eased. Chipmakers rallied sharply, bolstered by improved guidance and cooling inflation fears. Meanwhile, cyclicals participated in the rebound, supported by optimism that global growth would not be as impaired as initially feared.
An interesting development was the abrupt reversal in the value-versus-growth dynamic. After several quarters of relative strength, value stocks lagged noticeably, while growth—particularly mega-cap growth—roared back. This rotation underscored how sentiment, rather than pure fundamentals, dominated trading flows in Q2.
The U.S. dollar, its effect on equity portfolios, and why we diversify
While U.S. equity markets experienced dramatic swings up and down, non-U.S. markets experienced steady rises throughout the quarter, seemingly unperturbed by the looming threat of trade wars. The MSCI EAFE index was up nearly 12% on the quarter, and over 19% year-to-date. Emerging market equities were up even more on the quarter and posted a year-to-date return of 15%. Much of this return, however, came from their strengthening currencies (or weakening U.S. dollar). See the chart below on why we have consistently recommended a more global approach to equity portfolios – across asset classes and across regions. While the focus is often on U.S. stocks, 2025 has been a year where non-U.S. stocks have added notably to your portfolio.
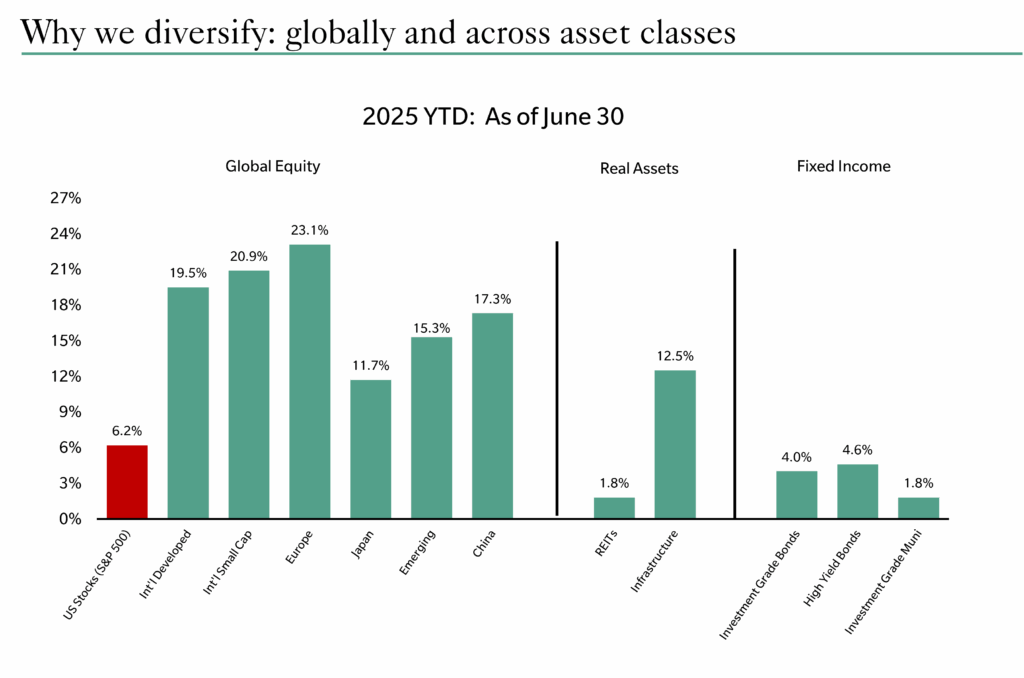
Source: Standard & Poor’s, MSCI, FTSE, DJ Brookfield, Bloomberg, ICE BofA, Index returns. Any investment can result in total loss. Past performance is not necessarily indicative of future performance.
Interest Rates: A Round-trip Journey for Long-term Yields & The Fed
Interest rates remained volatile, as well, this quarter, influenced by many of the same forces, albeit in different directions: trade policy uncertainty, inflation fears from tariffs (and other inflationary forces such as immigration crackdowns), and future tax policies (i.e., the Big Beautiful Bill). In the end, though, interest rates moved far from their starting point only to return to where they began.
The U.S. 10-year Treasury yield began the quarter at 4.23%, fell to 4.01% during the tariff panic in early April, and then climbed as high as 4.60% before settling at 4.19%, nearly exactly where it began. While the endpoint masked the volatility underneath, fixed-income investors had plenty to think about.
The initial move lower in yields reflected deep concern that tariffs would act as a tax on consumers and a drag on both U.S. and global economic growth. Global manufacturing indicators, particularly in Europe and East Asia, had already shown signs of softening, and bond markets quickly priced in a higher probability of recession.
But that narrative didn’t last long. By mid-May, attention had turned away from trade and toward fiscal dynamics. Specifically, the “Big Beautiful Bill”—a sweeping fiscal stimulus and infrastructure package created a new fear: that U.S. deficits could spiral.
Estimates from the Congressional Budget Office projected that the package if passed without offsets, could add nearly $2.5 to $3 trillion to the national debt over the next decade. That prospect sent bond yields soaring, with the 10-year reaching its peak in early June. However, as political negotiations began to stall and encouraging data on the inflation front emerged, yields backed off once again.
Fed-watching
Throughout the quarter, the Federal Reserve maintained its policy rate range at 4.25% to 4.50% and kept a watchful eye on the shifting landscape. Chair Powell and other members of the FOMC made clear that while inflation had cooled, they were not yet prepared to cut rates absent signs of economic slowdown. While President Trump’s social media posts have been unsparing in his demand that Powell lower rates in the face of encouraging inflation numbers, the Fed is still taking a cautious approach.
Credit and Spreads: Holding Steady
Despite volatility in both stocks and Treasuries, credit markets remained remarkably well-behaved. Investment-grade credit spreads widened modestly in early April but quickly tightened back to pre-quarter levels as equity markets recovered. High-yield bonds, often a bellwether for risk appetite, posted positive returns for the quarter, supported by falling default rates and continued demand from yield-hungry investors.
Muni bond markets held steady, delivering a return of roughly 1.8% on the quarter. Fears of the tax exemption for muni bonds being rescinded in the upcoming legislation proved unfounded.
Key Takeaways
Against a backdrop of rollercoaster moves in both the equity and bond markets, we are satisfied that client portfolios have remained resilient. As we look out into a cloudier-than-normal horizon, here is our current thinking:
Base case assumptions for 2025 and beyond:
- Cooler heads should continue to prevail: a full-on trade war should be averted, but heightened tensions remain.
- Negotiations: Some trade concessions have been extracted – the U.K., Canada, Mexico, Europe, Japan, India – and negotiations with China should likely be more protracted.
- High levels of uncertainty remain, so bouts of volatility throughout the back half of 2025 would not be odd.
- Some tariffs remain, but global supply chains should be able to adjust.
- We should avoid a recession; if one ensues, it should be mild, as unemployment remains low, and stimulative policies should help.
- Economic data should remain “foggy”. Behaviors have been distorted by the tariff drama. Soft data (the “mood” of the country, for example) will likely continue to conflict with hard data.
- Big Beautiful Bill. The legislation is not a done deal—and not without controversy—as of this writing, but it is likely that the final version will contain a bevy of pro-growth and business-friendly components, including permanent tax cuts, deregulatory measures (particularly in banking and energy production), and more favorable tax treatment of R&D expensing and capital investments.
In terms of investment portfolios:
- Maintain a U.S. equity overweight. If it made sense given your particular tax situation, we did conduct a modest shift to non-U.S. equities over the quarter. Either way, we maintain a globally diversified equity portfolio.
- Credit spreads remain tight, so we continue to hold a lower-than-normal amount of high-yield. If spreads widen and yields become more attractive, we might consider moving the dial a bit on the credit front.
- If there are bouts of volatility, harvest losses, and continue or accelerate dollar-cost-averaging programs.
- Most importantly, stay the course: we built resilient portfolios by design.
About Pete Chiappinelli, CFA, CAIA, Chief Investment Officer
Pete is a Partner and Chief Investment Officer at the firm. He is focused primarily on Asset Allocation in setting strategic direction for client portfolios.
This report is the confidential work product of Ballentine Partners. Unauthorized distribution of this material is strictly prohibited. The information in this report is deemed to be reliable. Some of the conclusions in this report are intended to be generalizations. The specific circumstances of an individual’s situation may require advice that is different from that reflected in this report. Furthermore, the advice reflected in this report is based on our opinion, and our opinion may change as new information becomes available. Nothing in this presentation should be construed as an offer to sell or a solicitation of an offer to buy any securities. You should read the prospectus or offering memo before making any investment. You are solely responsible for any decision to invest in a private offering. The investment recommendations contained in this document may not prove to be profitable, and the actual performance of any investment may not be as favorable as the expectations that are expressed in this document. There is no guarantee that the past performance of any investment will continue in the future.
Please advise us if you have not been receiving account statements (at least quarterly) from the account custodian.