
Imagine it is 1979. The U.S. is facing a toxic mix: inflation running out of control at 14% annually, paired with deeply negative GDP growth (the term “stagflation” was coined in this era). Unemployment stands at nearly 8%. The nation is in the midst of a humiliating foreign policy crisis as American embassy hostages are held in Tehran. Interest rates are approaching 18%, setting the stage for what would become the S&L banking crisis, in which over 1,000 banks eventually failed. The mood is bleak. The University of Michigan Consumer Sentiment Index[1] captured that despair with one of its lowest readings on record, and with good reason.
Fast forward to today.
The U.S. economy looks remarkably solid. GDP is growing at a strongly positive and healthy clip, unemployment remains near its half-century low, and inflation is hovering around its 10-year average. Profit margins are near all-time highs, as is the stock market, and banks are posting record earnings.
Yet the Michigan Consumer Sentiment Index – the mood – today is bleaker than it was in 1979.
Consumer sentiment: the worst in almost 50 years? Really?
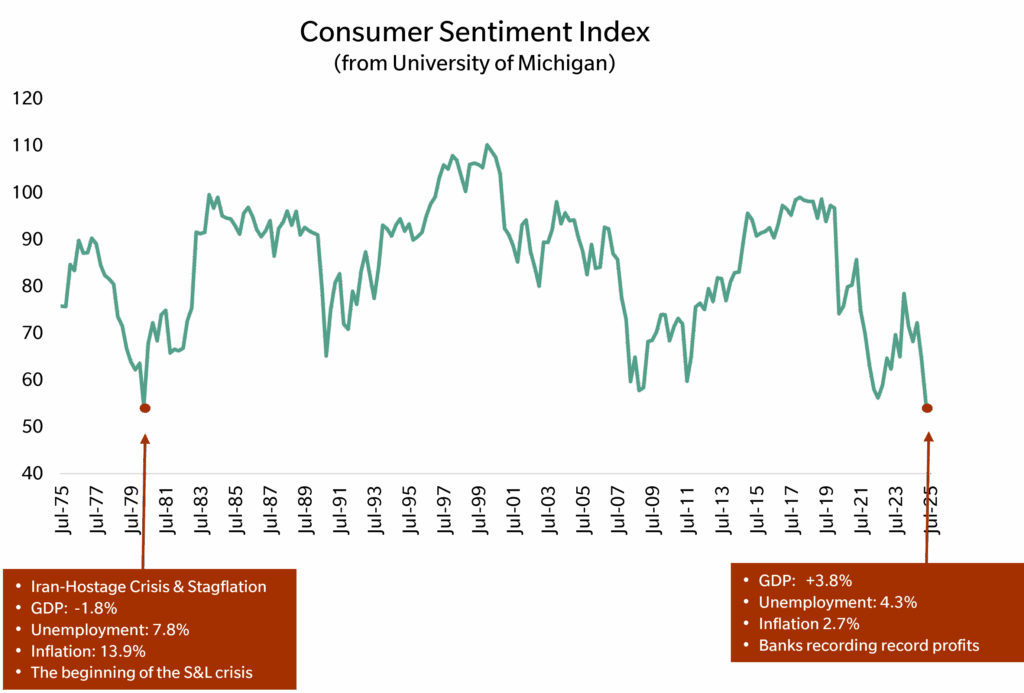
Source: University of Michigan, Ballentine Partners.
U.S. and global market having a very good year thus far

Source: Standard & Poor’s, MSCI, FTSE, DJ Brookfield, Bloomberg, ICE BofA. Index returns. Past performance is not necessarily indicative of future performance. Any investment can result in total loss.
It is a prosperity paradox: an economy that is thriving but feels to many Americans like anything but. The divergence between the reality of prosperity (in the aggregate) and the perception of gloom is one of the defining contradictions of 2025.
In this letter, we unpack that paradox in three stages. First, we examine the state of the economy through growth, labor markets, wages, and corporate activity. Second, we explore the bad mood itself and why sentiment appears disconnected from fundamentals. Finally, we assess risks and mitigating factors as we navigate markets.
The State of the Economy
The hard data tells a story of economic resilience.
Growth and Output
The most recent GDP revision pushed growth up to 3.8% and early indicators are that Q3 will be just as strong, if not stronger: fiscal stimulus from the recently enacted OBBBA (One Big Beautiful Bill Act) could add further incentive.
Labor Markets and Wages
Unemployment, at 4.3%, has ticked up slightly but remains bouncing around half-century lows. More importantly, real wages (i.e., adjusted for inflation) have been rising for 28 consecutive months.
Despite headline inflation, real wage growth is healthy
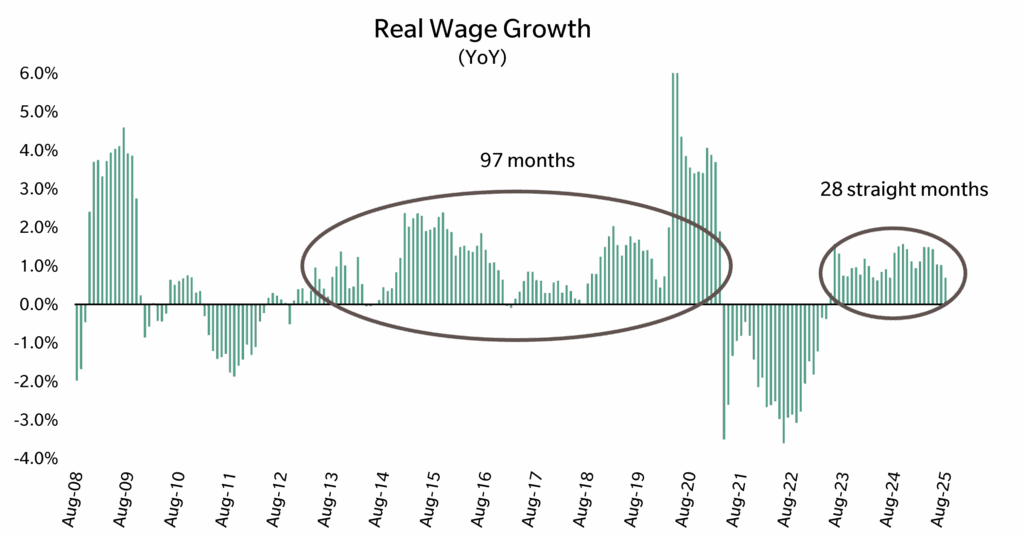
Source: Bureau of Labor Statistics, Federal Reserve, Ballentine Partners. Graph has been truncated for extremes.
Robust consumer spending
Discretionary spending on travel — typically curtailed when pessimism prevails — tells the same story: Americans are still traveling, shopping, and eating out. Even big-ticket purchases, typically the first to falter when interest rates rise, have proven resilient. Spending on furniture and appliances continues despite higher financing costs.
Consumer: discretionary spending looks solid

Source: TSA, Bloomberg, Ballentine Partners. Data is rolling ten-day average.
Spending on big ticket items remains resilient despite higher interest rates

Source: U.S. Bureau of Economic Analysis, Federal Reserve, Ballentine Partners. Graph has been truncated for extremes.
It is fair to point out that many Americans in middle and low-income households are not the ones taking trips or purchasing furniture. Therefore, they are experiencing this economy in a different way. But it would also be correct to point out that aggregate consumer spending is being driven disproportionately by upper-income households. See the chart below, which tells the story. And these upper-income households’ consumption patterns have benefited the most from rising home values and rising stock prices, the so-called “wealth effect.”
U.S. economy is disproportionally driven by high-income households. Economy not as affected by the spending of lower-income households.
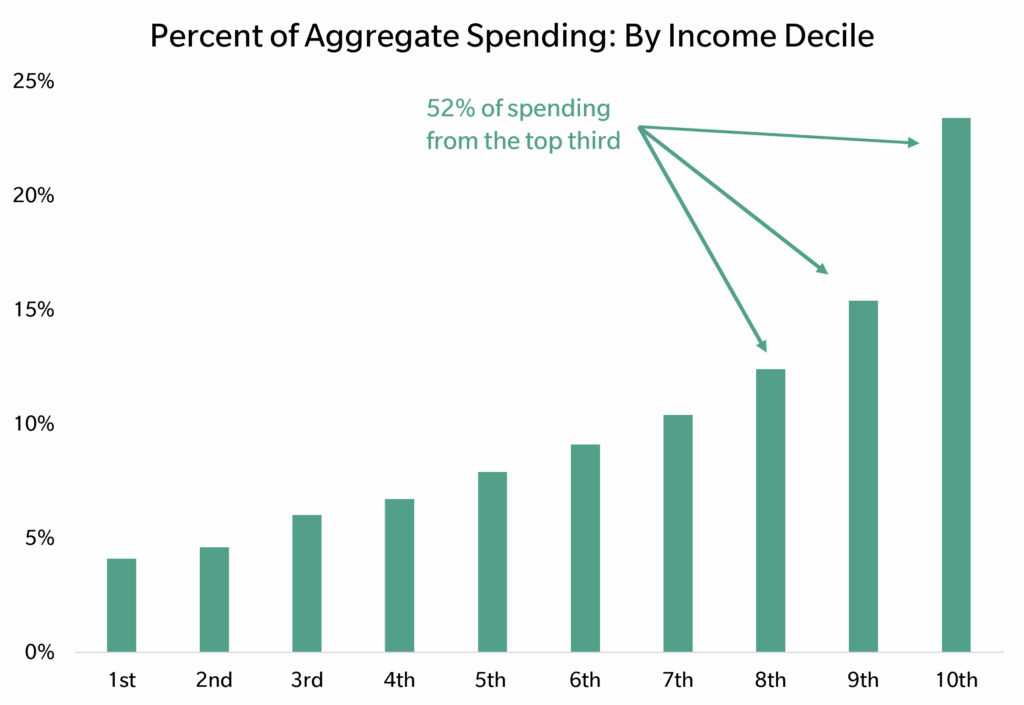
Source: Bureau of Labor Statistics, September 2024
Business Investment and Credit
Corporate America is also spending. Bank loan growth has strengthened, and capital expenditure is on the rise. This reflects not only the AI boom but also a structural shift in how businesses deploy capital in a digital economy.
Capital expenditure: AI projects are a meaningful contributor to GDP

Source: Bloomberg, Barclays Research
Put together, the data reveals an economy that is stronger than average, not weaker.
Mystery
Yet the mood of America could not be more dour. Why the disconnect? A few possible explanations come to mind (and these are not meant to be exhaustive):
- Lingering tariff uncertainty. Although trade policy uncertainty has eased from the extremes earlier in the year, American consumers and business leaders are still uncertain as to the future impact, their response, and the seeming randomness of the policy.
- Cost-of-living anxiety. Even if inflation is statistically moderate, people acutely feel the pinch of higher prices on essentials like rent, food, and energy. Psychology rarely aligns neatly with averages.
- Looming job insecurity. While layoffs are not occurring in any large or concerted fashion, headline news constantly beats the drum on how AI will transform the workforce, where no job, no industry, no career path is immune from potential redundancy or repricing.
- Wealth inequality. As earlier charts illustrate, higher-income households account for a disproportionate share of U.S. consumption. For the average American, it can feel like the prosperity is happening to someone else.
- Housing prices. If you are currently a homeowner, you likely are sitting on a reasonable mortgage and are sitting in a house that, in many instances, has made you hundreds of thousands of dollars “richer.” If, however, you are a renter (roughly a third of households), home ownership seems far out of reach due to higher mortgages and inflated home prices.
- Social media consumption. Studies have shown that our brains are wired to pay more attention to alarming headlines. Modern society, with ubiquitous smartphones, means that we are constantly bombarded with negative news — reinforced by algorithms — designed to capture our attention in a crowded media environment. Doom-scrolling is a real thing.[2]
In short, while the economy (in the aggregate) appears sound, the lived experience of many households remains out of sync.
Risks, Mitigants, and Portfolio Implications
Despite our relatively benign view of the economy, we must recognize that no economy or market is risk-free.
Risks
- Lofty valuations. By many historical measures, U.S. large and mega-cap stock valuations are stretched — with price-to-sales and price-to-earnings ratios at or near levels last seen during the tech bubble of the early 2000s. If earnings disappoint, there could be a reckoning.
- Monetary policy uncertainty and inflation reignition. Much of the equity market rally has been built on the expectation that the Fed will cut rates. If inflation proves stickier than anticipated, labor costs rise due to immigration policy shifts, or tariffs feed through to consumer prices more forcefully in the coming months and quarters, future rate cuts could be delayed, smaller than hoped for, or shelved entirely. This might weaken the case for equities.
- Global and Political Uncertainty. Tariffs, trade tensions, and geopolitics could reintroduce volatility. While the Trade Policy Uncertainty Index has eased, it remains elevated by historical standards.
- Sour sentiment finally does curtail consumption. Despite all the data on how strong the underlying economy is, there is still a risk that perception finally drives behavior. If consumer sentiment worsens, at some point, consumer spending could soften. And the risk of a “negative wealth effect” means that an equity correction could feed on itself.
Tariff-induced uncertainty remains high but off extremes

Source: Economic Policy Uncertainty (EPU) US monthly trade policy uncertainty index, Ballentine Partners.
Mitigants
Valuation risks are the ones that are getting the most attention. And comparisons to the dot-com era are certainly worrisome. However, there are important differences between today and the late 90s that add important nuance to any bubble comparisons.
- Interest Rates. In the late 1990s,10-year Treasury yields hovered around 6.5–7.25%. Today, they are closer to 4% and have been trending lower throughout most of 2025. Lower interest rates support higher valuations.
- Credit Spreads. Corporate debt is cheaper now, with credit spreads (the extra yield that corporations pay when they borrow) less than half their 1999 levels. The cost of capital, then, is cheaper, also supportive of higher valuations.
- Index Composition. The S&P 500 is now dominated by asset-light technology companies rather than the asset-heavy and cyclical industrial and energy companies of the late 90s, making earnings less volatile, again supportive of higher valuations.
- Profit Margins. Corporate profit margins for the S&P 500 today are roughly double what they were in 1999-to-2000 time frame. And given accounting treatment of intangible investments, even those margins may be understated for modern tech companies. Higher profit margins support higher valuations.
Asset-light companies now dominate the S&P 500. Different from bubble era.
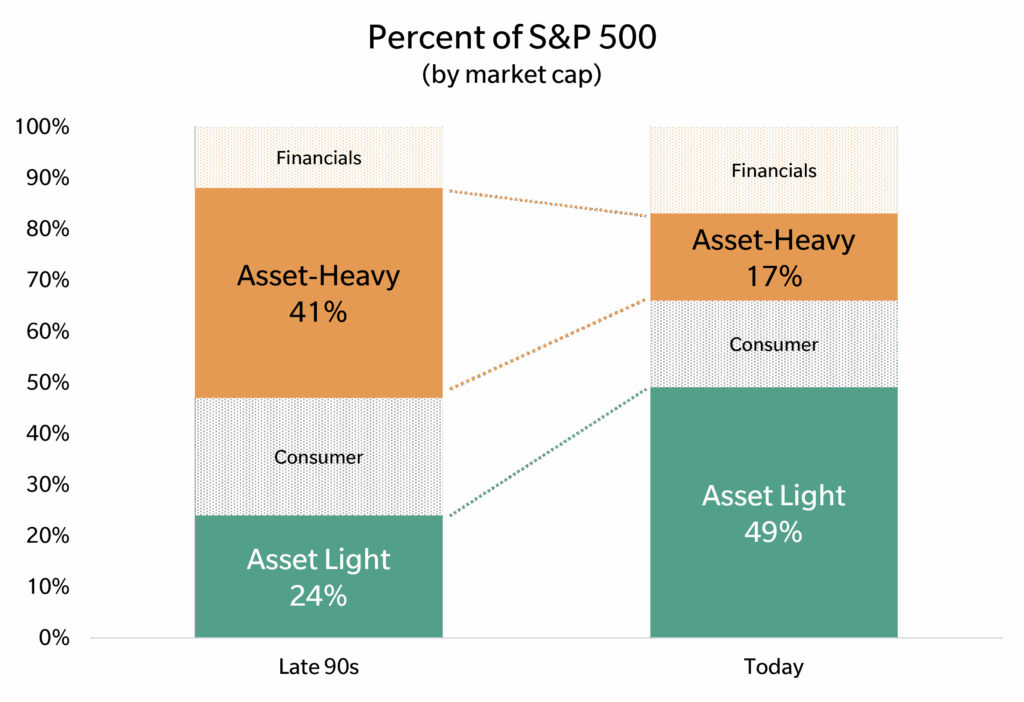
Source: Haver Analytics, Factset, BOFA U.S. Equity and Quant Strategy via Savita Subramanian and Jill Carey Hall Asset-light sectors include technology, communication services ex-telecom, and health care. Asset-heavy sectors include industrials, materials, energy, utilities, and telecom.
Profit margins on the S&P 500 have almost doubled since the bubble era.
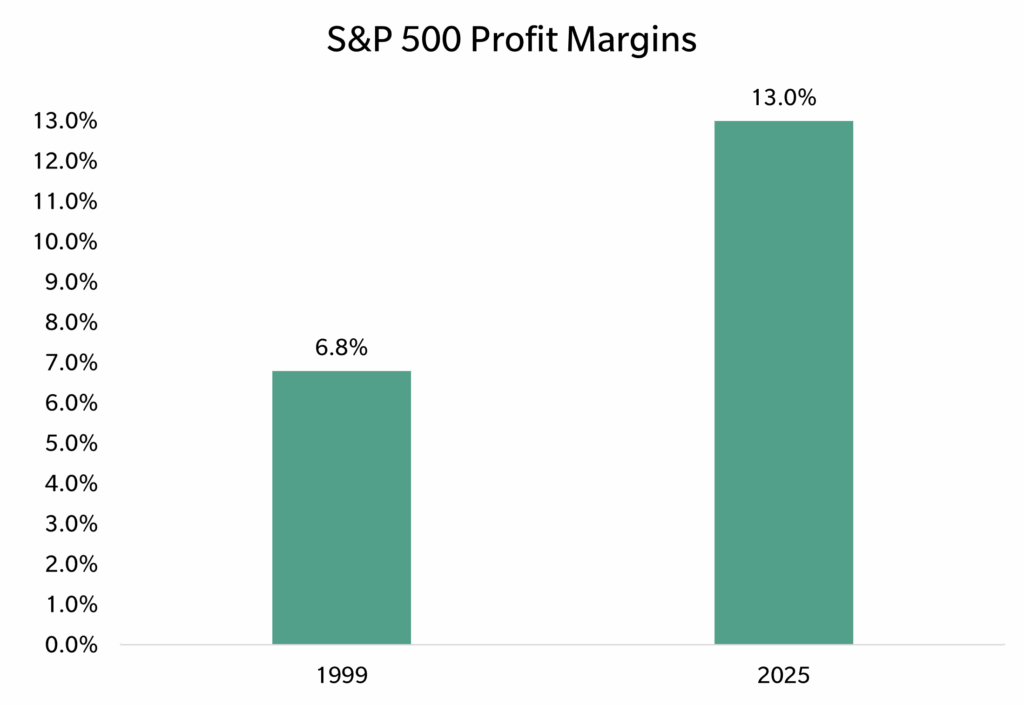
Source: Yardeni and LSEG Datastream. S&P 500 operating earnings per share divided by revenues per share.
Portfolio positioning
Having said all of that, we are still prudently managing valuation risk.
- Small and mid-cap tilt. We have maintained a tilt toward small and mid-cap U.S. equities, which remain attractively valued relative to large caps — at some of the widest discounts in over 20 years.
- International diversification. We recently trimmed U.S. equity exposure to lean more heavily into non-U.S. markets, where valuations are more reasonable. Europe, in particular, has potential for further gains as stimulus related to defense and infrastructure spending could unlock value and trigger a re-rating. In Japan, companies are announcing record stock buybacks to boost stock prices. Further, as U.S. interest rates are likely to fall further and the current administration’s efforts to re-shore manufacturing, the weakening trend of the U.S. dollar may continue, helping the returns of non-dollar assets.
- Rebalancing discipline. After the rapid run-up in Q3, we are reviewing U.S. equity positioning and trimming as needed for client portfolios to keep allocations in line with long-term targets.
- Credit risk management. In fixed income, we are holding a smaller-than-normal allocation to credit risk, reflecting caution about spreads and corporate leverage.
The essence of our approach is to participate in growth where it is attractively priced, but to reduce overexposure where sentiment has pushed valuations to lofty levels.
Navigating the Prosperity Paradox
The U.S. economy of 2025 defies an easy narrative. By the numbers, it is thriving: strong GDP growth, rising wages, robust spending, and healthy corporate profits. And yet Americans are the most pessimistic they’ve been in almost half a century.
The Prosperity Paradox, therefore, will continue to create uncertainty and murkiness. Soft data paints one picture while hard data paints another. Our job is to navigate this murkiness with prudence, humility, and respect for risks. This means the following: keeping to a disciplined process, diversifying globally and diversifying among asset classes, tilting portfolios toward value where it exists, and tilting away from assets with stretched valuations.
About Pete Chiappinelli, CFA, CAIA, Chief Investment Officer
Pete is a Partner and Chief Investment Officer at the firm. He is focused primarily on Asset Allocation in setting strategic direction for client portfolios.
This report is the confidential work product of Ballentine Partners. Unauthorized distribution of this material is strictly prohibited. Information obtained from third-party sources is believed to be reliable; however, the accuracy of the data is not guaranteed and may not have been independently verified. Some of the conclusions in this report are intended to be generalizations. The specific circumstances of an individual’s situation may require advice that is different from that reflected in this report. Furthermore, the advice reflected in this report is based on our opinion, and our opinion may change as new information becomes available. Nothing in this presentation should be construed as an offer to sell or a solicitation of an offer to buy any securities. You should read the prospectus or offering memo before making any investment. You are solely responsible for any decision to invest in a private offering. The investment recommendations contained in this document may not prove to be profitable, and the actual performance of any investment may not be as favorable as the expectations that are expressed in this document. There is no guarantee that the past performance of any investment will continue in the future.
[1] The oldest and longest-running survey of the American “mood.” It is survey that measures U.S. consumer confidence in the economy, reflecting their views on personal finances, business conditions, and buying conditions. A higher index value generally signals greater confidence while a lower value suggests pessimism.
[2] Doomscrolling Dangers, by Marueen Salamon, Harvard Health Publishing, Harvard Medical School. September 1, 2024